Bathymetry
Bathymetry is the measurement of water depth. Our bathmetry data is a mixture of single-beam echo sounder (SBES) and multi-beam echo sounder (MBES) surveys of the entire South West coast. These surveys are important as they map the intertidal area between the height of mean high water neaps (MHWN) up to 1 km offshore.
Shallow water has traditionally been left out of most bathymetric surveys as it is very difficult and time consuming to survey. This means that when you look at most seabed charts you'll see what is known as the 'white ribbon' - an empty white strip along the coast where no information is available. We set out to survey this area and chart the white ribbon around the South West coast, which we successfully achieved in the second phase of our Programme.
To collect such high quality data, we work together with the UK Hydrographic Office, Maritime and Coastguard Agency and Natural England on large sections of the coast.
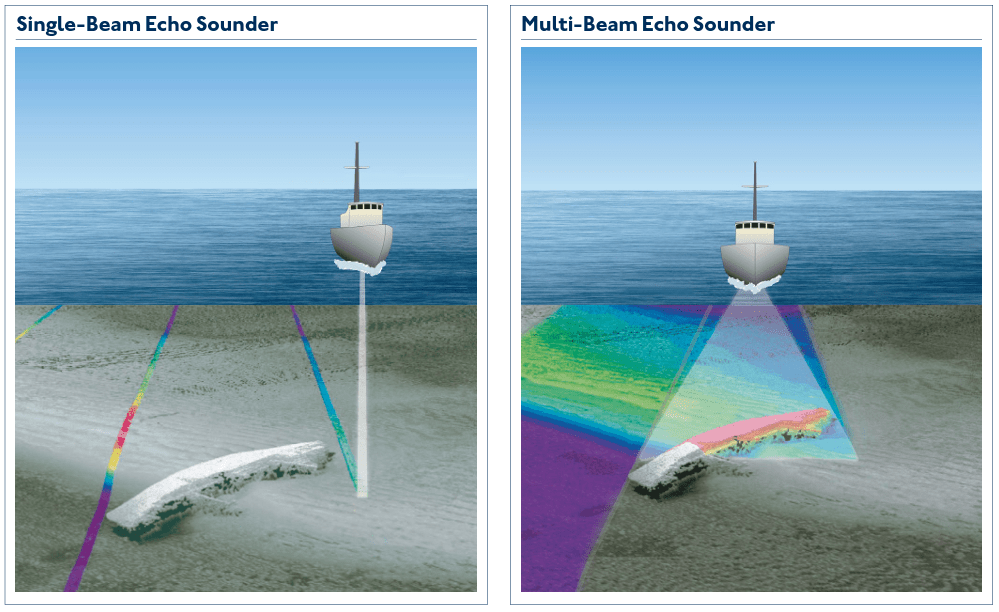
Courtesy of Admiralty Maritime Data Solutions - A guide to bathymetry (2020)
A single-beam echo sounder uses just one transducer to map the seafloor, whereas a multi-beam echo sonar sends out multiple, simultaneous sonar beams (or sound waves) in a fan-shaped pattern. This covers the space both directly under the ship and out to each side. Multibeam collects two types of data: seafloor depth and backscatter. The seafloor depth, or bathymetry, is computed by measuring the time it takes for the sound to leave the array, hit the seafloor, and return to the array (National Oceanographic and Atmospheric Administration, NOAA).
Data Capture
Our bathymetry is primarily collected by a chartered vessel, mounted with either an SBES or MBES, as well as other equipment e.g. sound velocity profiler, sediment grab samplers and GNSS equipment (Global Navigation Satellite System) . Some smaller areas are being captured using a USV (Uncrewed Surface Vessel). The sensors are mounted looking vertically down, to collect birds-eye images of the seabed.
Bathymetric data is usually captured during the summer when waves are smaller (<0.5 m), especially along the North coast of the South West. Calmer waves lead to reduced boat movement, ensuring a more accurate dataset. However, summer data collection can be challenging due to increased boat and human activity near the shore. This limits the available time to gather coastal bathymetry and outlines how difficult this dataset can be to capture.

Data Outputs
Our bathymetric data supports the Environment Agency's Strategic Objectives to provide evidence for managing coastal flooding and change and informs planning relating to both the protection and creation of nationally and internationally important coastal habitats and biodiversity.
Uses of bathymetric data include:
- Measurement of changes and rates of change of dynamic sediments below low water.
- Production of detailed surveys for design and updating of models of nearshore wave climate and sediment transport.
- Identification of small submerged features which may affect sediment transport processes.
- Planning, design and construction of new works in the nearshore zone.
- Location and measurement of changes within offshore sediment sinks.
- Bathymetry of Mounts Bay (south Cornwall), captured in 2022.
2. Bathymetry of Bude (north Cornwall), captured in 2023.
Additional Outputs
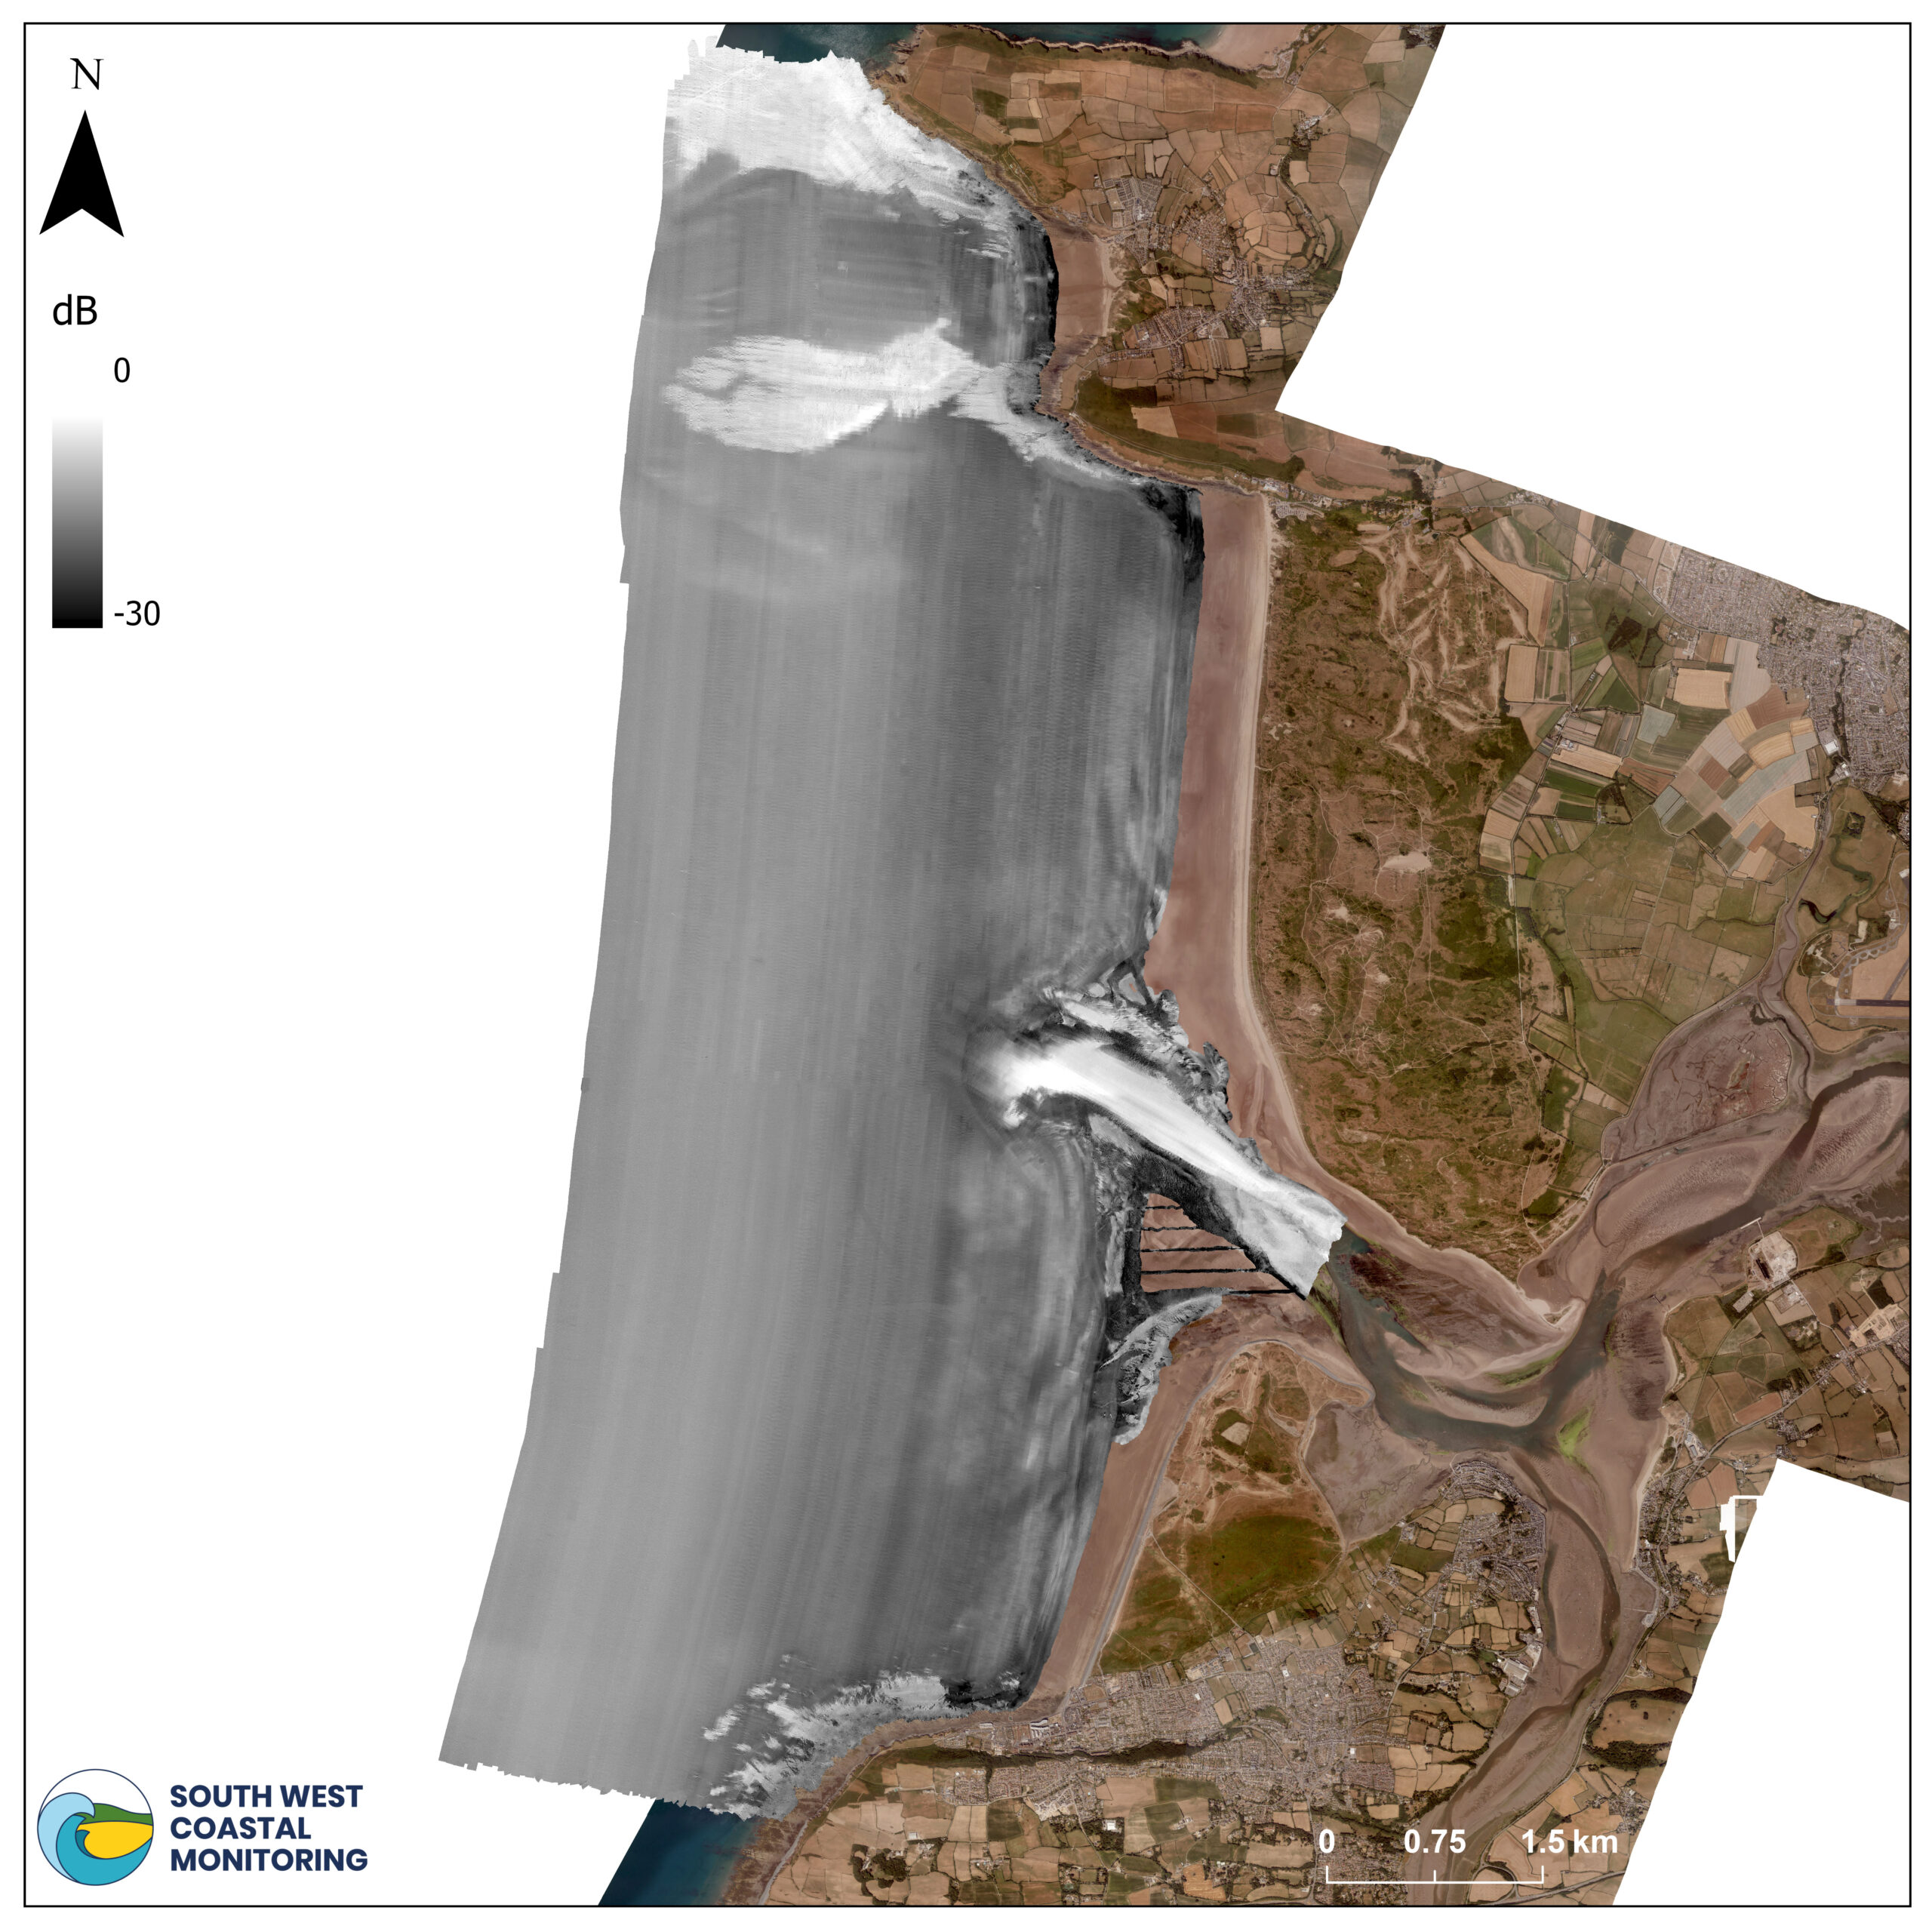
3A) Backscatter data of Bideford Bay, captured in August 2024.

3B) Seabed classification of Bideford Bay, indicating rock, sand, and sandy gravel. The locations of wrecks (wreck icon) and sediment samples (red star) are also presented, captured in August 2024.
Listening to the Seafloor: Understanding Seabed Features
Alongside multibeam bathymetry, we use backscatter data to learn more about what the seabed is made of (see Image 3A). This technique listens for how much sound bounces back from the ocean floor—measured in decibels (dB).
Darker areas on the map show places where less sound was reflected, which usually means a softer, sandy seabed or mud-like material. Lighter colours represent areas that reflect more sound, indicating harder surfaces like rock or gravel.
Using backscatter data, in combination with ground truthing (sediment grab samples) we can identify different types of seabed materials—like sand, rock, gravel, and mud. In Image 3B, you can see a clear visual of where these different seabed types are located across the bay. Sediment samples are used for ground truthing (red stars) to confirm the seabed type. As you might expect, the areas next to the rocky cliffs also have a rocky seabed. Meanwhile, most of the bay itself is made up of soft, sandy material.
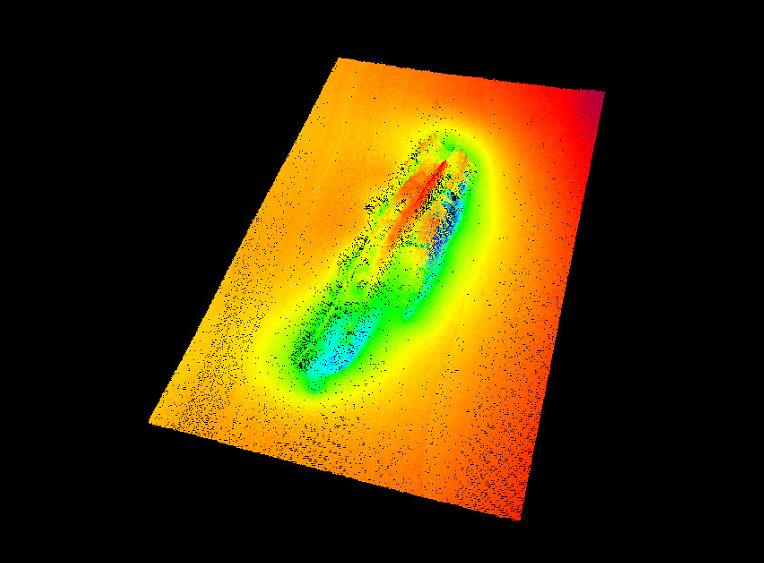
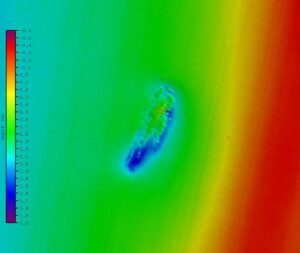
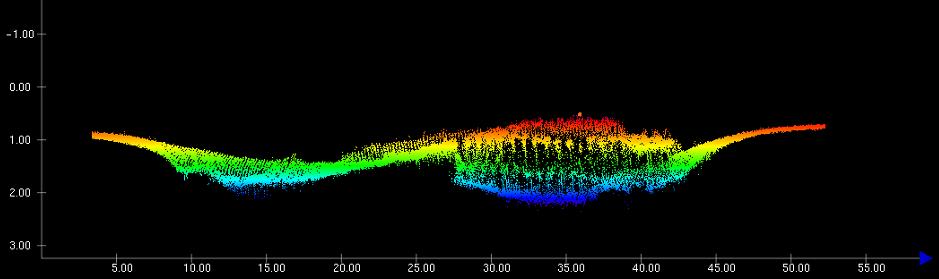
As part of our specification the surveyors must identify wrecks and conduct a more detailed survey across the area (see image X).
These datasets are not available on the National Monitoring website, but can be sent on request via coastal.observatory@plymouth.ac.uk.
4A
4B

Figure 5 - Multibeam coverage of Bideford Bay (2024).
4C
Figure 4 - A, B, and C are zoomed in images of one of the wrecks identified in the 2024 Bideford Bay survey.
Let's Keep In Touch
We’ll keep you up-to-date with all the latest news on this website, but we’d also love to be able to send the occasional update.
We promise we'll only use your details to tell you about what we’ve been doing.